Do you want to know how many people are visiting your website, where they are coming from, and what they are doing on your site? Once you know this, you can use the information to improve your website performance, user experience, and business goals. Welcome to Google Analytics.
Google Analytics is a free web tracking tool offered by Google that helps you analyze how visitors interact with your website. It is one of the most popular and powerful tools for website owners, marketers, and developers.
How to Use Google Analytics to Improve Your Website and Business Performance
Google Analytics is a tool to help you use data to improve your website and business performance. By using Google Analytics, you can identify and solve common website pain points, such as low traffic, high bounce rate, poor user experience, and low conversion rate. You can also use Google Analytics to optimize your website design, content, marketing, and achieve your business goals. Here are some examples:
Traffic Sources
Increase the RIGHT website traffic by finding out which traffic sources and channels are driving the most engagement on your site. Then, focus on improving and expanding the traffic sources and channels that result in conversions (or at least desired actions), and tweaking or eliminating the traffic sources and channels that are not producing engagements.
Keywords and Key Phrases
Also, you could find out which keywords and phrases are bringing the most and the least organic, converting traffic to your website and then optimize your website content and SEO for the keywords and phrases that are relevant and popular for your audience and niche. I highly recommend Neil Patel’s SEO Unlocked course (free) for more details and a great primer on keyword research.
Bounce Rate
Use Google Analytics to find out which pages and content are being abandoned after one visit, which is reflected as your “bounce rate”. Typical bounce rates vary by industry, but in the ERP VAR and ISV space, we see goal bounce rates somewhere in the 60s or 70s. Having “bounces” is not always indicative of a problem. I’ve often gone to a site just to look up their phone number, email, physical address, or just get one piece of information and then leave. While technically I bounced, it doesn’t mean that I was unhappy with the site experience. It just means I got what I came for. However, your website’s goal is to provide even the casual visitor reasons to stay! Keep this in mind as you create content.
User Experience
Google Analytics is also a useful tool to enhance your website user experience. You can use the traffic maps, which give you a graphical representation of the page journey your visitors take, to identify the way they think about your product or service. This can help you create more helpful resources for their journey. Tracking page abandonment can help you narrow in on underperforming copy, images, links and calls-to-action. By looking at these events, you can improve your website, offering more of what people want.
Let’s go over some of the basics of Google Analytics and how you can use it effectively for your website and business.
How to Set Up Google Analytics for Your Website
The first step to use Google Analytics is to create an account and add a small piece of JavaScript code to each page on your website. This code collects data from every user who visits your website and sends it to Google Analytics where it is sorted into reports for you and segmented by users, sessions, and events.
To create a Google Analytics account, you need to have a Google account. If you don’t have one, you can create one for free here. Once you have a Google account, you can follow these steps to set up Google Analytics for your website:
- Go to the Google Analytics website and click on “Sign in to Analytics”.
- Sign in with your Google account and click on “Set up for free”.
- Enter an account name, a property name, and a website URL. You can also choose your industry category, time zone, and data sharing settings.
- Click on “Create” and accept the terms of service.
- You will see a tracking ID and a tracking code. Copy the tracking code and paste it into the <head> section of every page on your website. Alternatively, you can use a plugin or a tag manager to install the code on your website.
That’s it! You have successfully set up Google Analytics for your website. It may take up to 24 hours for Google Analytics to start collecting and displaying data from your website.
How to Navigate the Google Analytics Dashboard and Reports
 Now that you set up Google Analytics, how do you use it? First, sign into Google Analytics and start on the dashboard. Here you will find 4 areas of data to explore. We recommend looking at the audience area to get an idea of who your website visitors are and where they are from. Next, if you have a blog, go to the behavior section and see if you can find out which blog is most popular.
- Audience: This section tells you who your visitors are, such as their demographics, interests, location, device, and behavior. You can use this data to understand your target audience and segment them into different groups.
- Acquisition: This section tells you where and how your visitors are coming to your website. For example, keywords, campaigns, landing pages, referrals, paid searches, and more. This data is useful to help you optimize your marketing strategies.
- Behavior: This section tells you what your visitors are doing on or how they are interacting with your website. It includes pages they visit, exit pages, time spent, the actions they take, and the events they trigger. You can use this data to improve your website design, content, and user experience.
- Conversion: This section is crucial for understanding and analyzing the goals and conversions on your website. In other words, it tells you the success of your website. For example, if you have an e-commerce website, this section provides key metrics related to online transactions.
All these sections have detailed reports that allow you to drill into the metrics further. Additionally, there are filter tools such as a date range selector, search box, and report tabs to filter and customize the data and views.
To help you get started, here are some of the most important and useful reports and data you should check out:
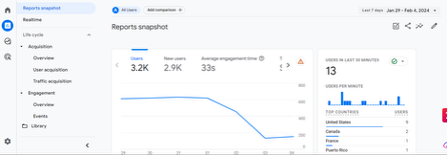
- Real-Time: This report shows you the data of the visitors who are currently on your website, such as the number, location, source, page, and event. You can use this report to monitor your website activity and performance in real-time and it’s useful for monitoring live events, campaigns, or sudden traffic spikes.
- Overview: This report shows you a high-level summary of your key metrics. Data you might see here are the number of users, sessions, bounce rate, and conversion rate. This report is a useful starting point for identifying trends, patterns, and potential areas for further analysis.
- All Pages: This report shows you the data and metrics of each page on your website, such as the top pages, content performance, content optimization, navigation analysis, pageview trends, landing pages, technical issues, exit pages, event tracking, conversion paths, and more.
- All Traffic: This report shows you the data and metrics of each traffic source on your website, such as channels, tree maps, referrals, social, campaigns, keywords, and more. You can use this report to compare and optimize your different traffic sources and channels and see what’s working and what’s not.
- Goals: This report is a critical tool for tracking and analyzing specific actions or interactions on your website that align with your business objectives. Goals represent desired outcomes, and the Goal report provides insights into how well your website is performing in terms of achieving those objectives.
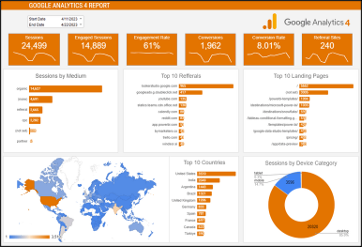
These are just some of the many reports and data available in Google Analytics. Besides these, you can also create custom dashboards and reports in Google Analytics to display and organize the data and metrics that matter to you.
Hopefully this gets you started with Google Analytics to help you measure and improve your website. If you want to learn more, or need a little help getting started, contact us today at Krizik Marketing Group.
[/et_pb_text][/et_pb_column][/et_pb_row][/et_pb_section]
Recent Comments